BUSINESS INTELLIGENCE
Dashboards decision-makers use daily
We build secure, role-based analytics using Power BI and Tableau. We model data, define KPIs and deliver dashboards that drive daily huddles and executive reviews. Sources include SQL Server, MySQL, PostgreSQL, spreadsheets, apps and APIs.
- Data Modeling: star schemas, conformed dimensions, DAX/LOD, slowly changing dimensions
- Security & Governance: row-level security (RLS), certified datasets, lineage, usage analytics
- Operations: scheduled refresh, subscriptions, anomaly alerts, incremental refresh
- Embedded BI: secure embedding for internal portals and customer apps
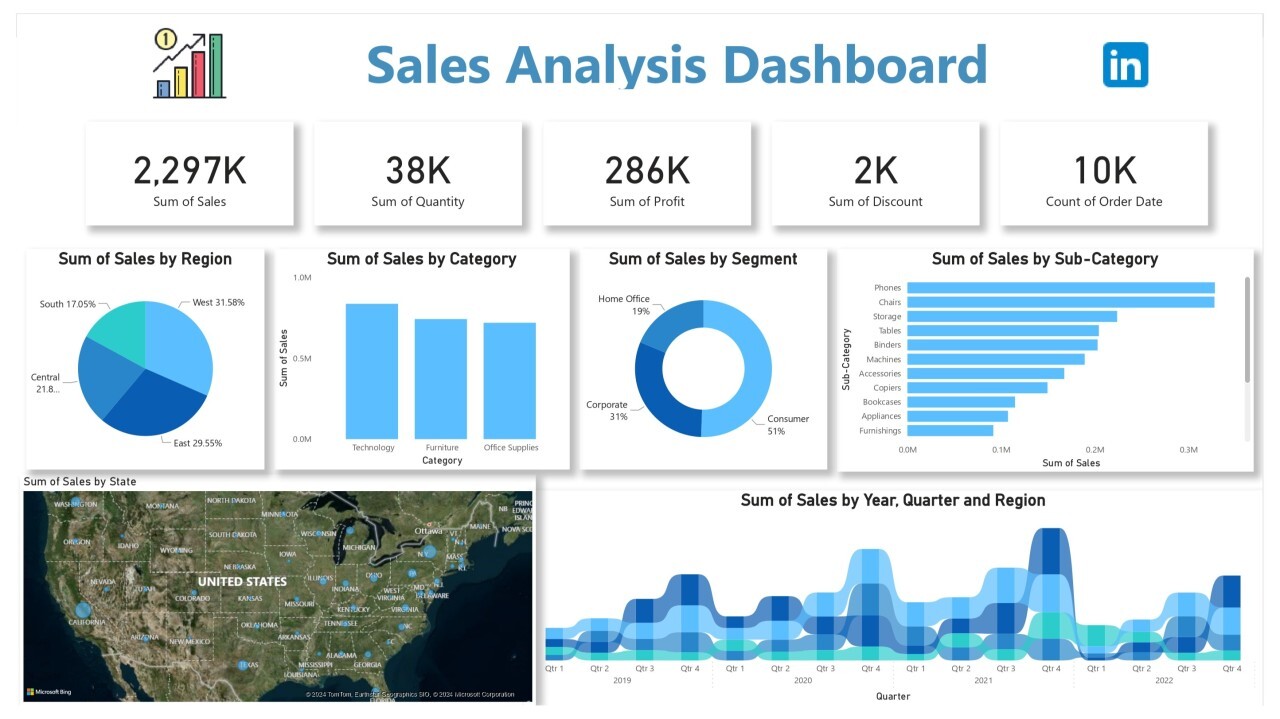
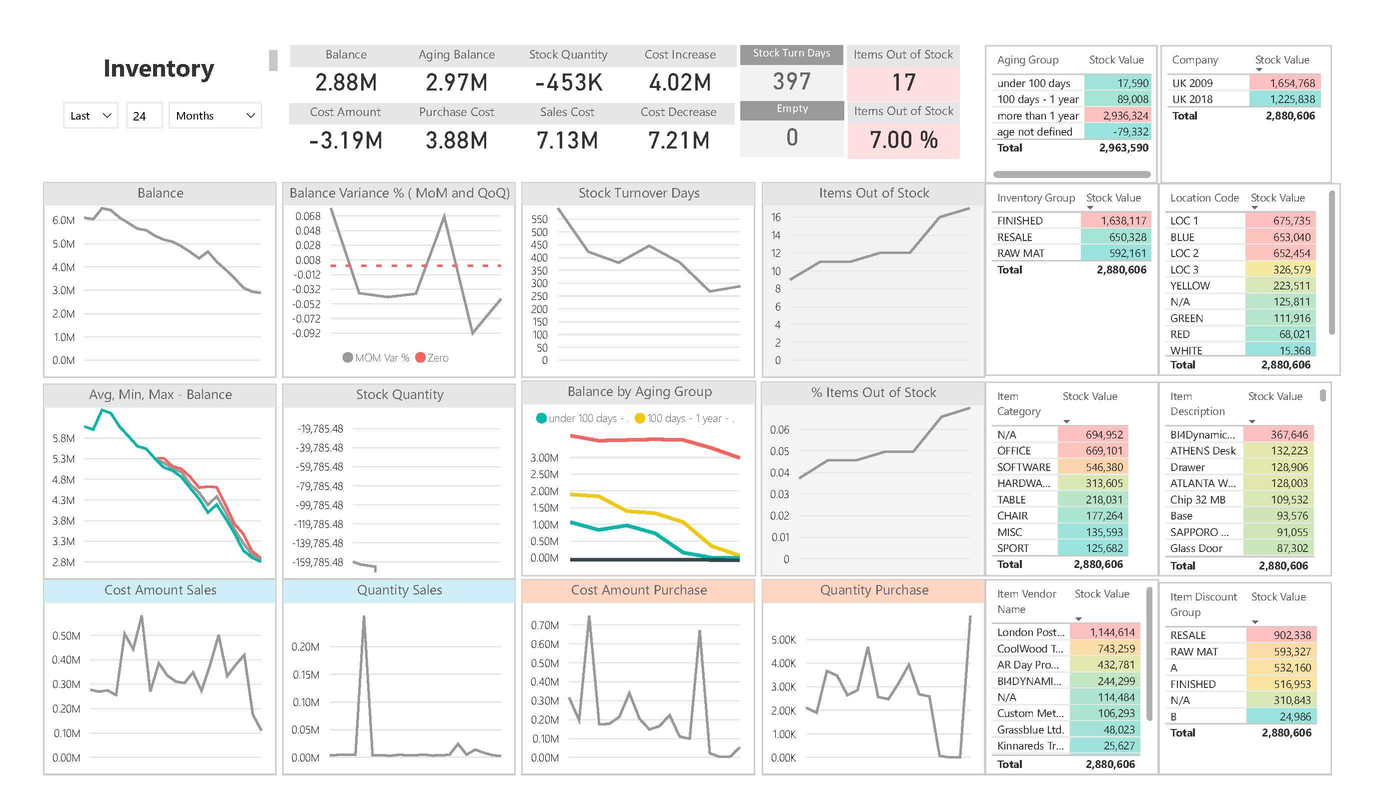
- Retail KPIs: sales by channel/store/category/SKU, GMROI, stockouts, aging, RFM, cohort CLV
Below are example visualizations. Replace these with your final dashboard screenshots or exported visuals when ready.
Typical Engagement
- Discovery workshop & KPI inventory
- Data source audit & modeling plan
- Prototype visuals & RLS design
- Production hardening & refresh setup
- Training, handover & governance